Introduction
In today’s world, auto scaling services have become essential to optimise on cost and provide highly available applications. The infrastructure you build should handle the traffic that comes its way. Under provisioning infrastructure leads to downtime or slowdowns during peak periods or when your application is under heavy load. Over provisioning your infrastructure for periods of high load wastes money when demand is low. A balance between the two needs to be found, and auto scaling is a good solution to this problem.
Auto scaling helps ensure that you always have the correct number of servers to handle the load of your application. Collections of servers or instances are grouped into Auto Scaling Groups. AWS allows you to specify the minimum number of servers in each auto scaling group. The Auto Scaling Group ensures that you don’t go below this minimum. You can also specify the maximum number of servers can be added to an Auto Scaling Group. AWS ensures that you don’t go over this maximum. You can also define a desired capacity or desired number of servers you want to run at a given time. AWS Auto Scaling dynamically adjusts the number of servers or running instances based on predefined metrics such as the CPU load, RAM usage, network traffic or other custom metrics you set up. When these metrics reach a threshold you specify, auto scaling actions are triggered and AWS either adds or removes instances from the Auto Scaling Group.
For example, a scaling policy based on CPU usage could be something like: “If the CPU usage is above 80% for 5 minutes, add 1 new server”. AWS Auto Scaling would remove the additional server(s) if CPU usage went down. The benefit of this that your application remains responsive even under high load, you only pay for what you use and it reduces idling costs. Auto scaling prevents servers from crashing due to being overloaded because they handle unpredictable traffic spikes efficiently.
If you’re interested in learning about the different approaches to auto scaling, checkout this article that introduces vertical, horizontal and dynamic scaling.
In this article I will show you how to scale EC2 Instances horizontally using AWS EC2 Auto Scaling. To create a dynamic and responsive auto scaling environment, we’ll use CloudFormation, CloudWatch and EC2 Auto Scaling. AWS CloudFormation is an Infrastructure as Code tool we’ll use to automate building the auto scaling infrastructure. CloudWatch is a monitoring service from AWS that will provide the eyes and ears for triggering scaling operations based on real-time performance.
Setting up Auto Scaling Architecture with CloudFormation
For the purpose of this post, we’ll create an auto scaling group with a minimum size of 1 EC2 instance and a maximum size of 3 EC2 instances, but you can use whatever values make sense for your application. We’ll use a Load Balancer to evenly distribute traffic across the instances and CloudWatch to create a monitoring dashboard for CPU and Network utilisation information for the Instances. We will use CloudFormation parameters (similar to variables in programming) to define environment-specific information like the VPC and type of EC2 instances we’re interested in. Using parameters makes the template reusable.
CloudFormation Parameters
This tutorial assumes that you have a VPC with at least two public subnets in your AWS account. Let’s create the Auto Scaling Group using CloudFormation. First, we define seven parameters. We’ll reference these parameters later in the CloudFormation template.
AWSTemplateFormatVersion: "2010-09-09"
Parameters:
  InstanceType:
    Description: EC2 instance type
    Type: String
    Default: t3.micro
    AllowedValues:
      - t3.micro
      - t3.small
      - t3.medium
  KeyName:
    Description: Name of an exisiting EC2 key pair to allow SSH access to the instances
    Type: "AWS::EC2::KeyPair::KeyName"
  LatestAmiId:
    Description: The latest Amazon Linux 2 AMI from the Parameter Store
    Type: "AWS::SSM::Parameter::Value<AWS::EC2::Image::Id>"
    Default: "/aws/service/ami-amazon-linux-latest/amzn2-ami-hvm-x86_64-gp2"
  OperatorEmail:
    Description: The email address to notify when there are any scaling activities
    Type: String
  SSHLocation:
    Description: The IP address range that can be used to SSH to the EC2 instances
    Type: String
    MinLength: 9
    MaxLength: 18
    Default: 0.0.0.0/0
    ConstraintDescription: must be a valid IP CIDR range of the form x.x.x.x/x
  Subnets:
    Description: At least two public subnets in different Availability Zones in the selected VPC
    Type: "List<AWS::EC2::Subnet::Id>"
  VPC:
    Type: "AWS::EC2::VPC::Id"
    Description: A virtual private cloud that enables resources in public subnets to connect to the internet
InstanceType limits the types of instances we can add to our auto scaling group to t3.micro, t3.small and t3.medium. This feature can be useful to keep costs low or to prevent users from spinning up expensive instances.
KeyName defines the name of an SSH Key to allow SSH access to the EC2 instances that will be created.
LatestAmiId Specify the ID of the AMI to launch. Before we can launch an EC2 instance, we need to specify which Amazon Machine Image(AMI) to use to launch the EC2 instance. An AMI is an image that provides the information required to launch an instance.
OperatorEmail: An email address to send scaling notifications to.
SSHLocation: The IP addresses that can SSH into the EC2 instances.
Subnets: This parameter will store the IDs of the subnets we want to deploy EC2 instances to.
VPC: The VPC parameter stores the ID of the VPC to create the Auto Scaling Group in.
In the next section, we’ll create the resources necessary to complete our architecture.
CloudFormation Resources
In this section, we’ll define the resources we need to setup an auto scaling architecture; Security Groups, a Load Balancer, an EC2 Auto Scaling Group, an SNS Notification Topic, and a Launch Template.
Resources:
  ELBSecurityGroup:
    Type: AWS::EC2::SecurityGroup
    Properties:
      GroupDescription: ELB Security Group
      VpcId: !Ref VPC
      SecurityGroupIngress:
        - IpProtocol: tcp
          FromPort: 80
          ToPort: 80
          CidrIp: 0.0.0.0/0

  EC2SecurityGroup:
    Type: AWS::EC2::SecurityGroup
    Properties:
      GroupDescription: EC2 Security Group
      VpcId: !Ref VPC
      SecurityGroupIngress:
        - IpProtocol: tcp
          FromPort: 80
          ToPort: 80
          SourceSecurityGroupId:
            Fn::GetAtt:
              - ELBSecurityGroup
              - GroupId
        - IpProtocol: tcp
          FromPort: 22
          ToPort: 22
          CidrIp: !Ref SSHLocation

  EC2TargetGroup:
    Type: AWS::ElasticLoadBalancingV2::TargetGroup
    Properties:
      HealthCheckIntervalSeconds: 30
      HealthCheckProtocol: HTTP
      HealthCheckTimeoutSeconds: 15
      HealthyThresholdCount: 5
      Matcher:
        HttpCode: 200
      Name: EC2TargetGroup
      Port: 80
      Protocol: HTTP
      TargetGroupAttributes:
        - Key: deregistration_delay.timeout_seconds
          Value: "20"
      UnhealthyThresholdCount: 3
      VpcId: !Ref VPC

  ALBListener:
    Type: AWS::ElasticLoadBalancingV2::Listener
    Properties:
      DefaultActions:
        - Type: forward
          TargetGroupArn: !Ref EC2TargetGroup
      LoadBalancerArn: !Ref ApplicationLoadBalancer
      Port: 80
      Protocol: HTTP

  ApplicationLoadBalancer:
    Type: AWS::ElasticLoadBalancingV2::LoadBalancer
    Properties:
      Scheme: internet-facing
      Subnets: !Ref Subnets
      SecurityGroups:
        - !GetAtt ELBSecurityGroup.GroupId

  LaunchTemplate:
    Type: AWS::EC2::LaunchTemplate
    Properties:
      LaunchTemplateName: !Sub ${AWS::StackName}-launch-template
      LaunchTemplateData:
        ImageId: !Ref LatestAmiId
        InstanceType: !Ref InstanceType
        KeyName: !Ref KeyName
        SecurityGroupIds:
          - !Ref EC2SecurityGroup
        UserData:
          Fn::Base64: !Sub |
            #!/bin/bash
            yum update -y
            yum install -y docker
            systemctl start docker
            docker pull your_dockerhub_username/image
            docker run  --rm -p 80:5000 your_dockerhub_username/image
  NotificationTopic:
    Type: AWS::SNS::Topic
    Properties:
      Subscription:
        - Endpoint: !Ref OperatorEmail
          Protocol: email

  WebServerGroup:
    Type: AWS::AutoScaling::AutoScalingGroup
    Properties:
      LaunchTemplate:
        LaunchTemplateId: !Ref LaunchTemplate
        Version: !GetAtt LaunchTemplate.LatestVersionNumber
      MaxSize: "3"
      MinSize: "1"
      DesiredCapacity: "1"
      NotificationConfigurations:
        - TopicARN: !Ref NotificationTopic
          NotificationTypes:
            [
              "autoscaling:EC2_INSTANCE_LAUNCH",
              "autoscaling:EC2_INSTANCE_LAUNCH_ERROR",
              "autoscaling:EC2_INSTANCE_TERMINATE",
              "autoscaling:EC2_INSTANCE_TERMINATE_ERROR",
            ]
      TargetGroupARNs:
        - !Ref EC2TargetGroup
      VPCZoneIdentifier: !Ref Subnets
Let’s go through the contents of the template above. We first define the ELBSecurityGroup and EC2SecurityGroups security groups to allow incoming HTTP traffic to the Load Balancer and HTTP and SSH to the EC2 Instances.
Next, we define a Target Group. In this context, a Target Group is a collection of EC2 instances that the load balancer will direct traffic towards. The EC2TargetGroup resource will perform HTTP health checks on port 80 every 30 seconds. It will expect a successful response with HTTP status code 200 and will consider targets unhealthy after 3 consecutive failures. The target group will reside within the VPC referenced by the VPC resource we will define shortly and will deregister unhealthy targets after a 20-second delay.
The next section defines an Listener for the Load Balancer. The ALBListener acts as an entry point for web traffic on port 80 and enables load balancing that ensures that traffic is distributed across the healthy available instances in the EC2TargetGroup.
After defining the listener, we define the ApplicationLoadBalancer and attach the ELBSecurityGroup we defined earlier to it. Next, we define a Launch Template. A Launch Template is a blueprint that defines the configuration for creating and launching EC2 Instances. It serves as a reusable template containing all the necessary parameters, allowing you to consistently launch instances with the same configuration across deployments. The Launch Template we defined here will launch the type of EC2 instance we defined in the parameters at the top, attach the EC2 instance to the EC2SecurityGroup we defined earlier and then run a script to install docker and pull an image and run it. Here, you’ll want to replace your_dockerhub_username with your own DockerHub username and image with the name of a Docker image you want to use.
Next, we define an SNS notification topic and add a subscription to it using the email address we defined in the parameters earlier. We will use this to send emails whenever a scaling event happens.
The last resource defines the Auto Scaling Group called WebServerGroup and configures it to use the Launch Template we defined earlier. We configure the auto scaling group to have a desired capacity of 1 EC2 instance, a minimum of 1 and a maximum of 3 instances. Next, we configure the auto scaling group to send messages whenever an instance is created or destroyed and whenever these operations fail.
The entire template should now look like this:
AWSTemplateFormatVersion: "2010-09-09"
Parameters:
  InstanceType:
    Description: EC2 instance type
    Type: String
    Default: t3.micro
    AllowedValues:
      - t3.micro
      - t3.small
      - t3.medium

  KeyName:
    Description: Name of an exisiting EC2 key pair to allow SSH access to the instances
    Type: "AWS::EC2::KeyPair::KeyName"
  LatestAmiId:
    Description: The latest Amazon Linux 2 AMI from the Parameter Store
    Type: "AWS::SSM::Parameter::Value<AWS::EC2::Image::Id>"
    Default: "/aws/service/ami-amazon-linux-latest/amzn2-ami-hvm-x86_64-gp2"
  OperatorEmail:
    Description: The email address to notify when there are any scaling activities
    Type: String
  SSHLocation:
    Description: The IP address range that can be used to SSH to the EC2 instances
    Type: String
    MinLength: 9
    MaxLength: 18
    Default: 0.0.0.0/0
    ConstraintDescription: must be a valid IP CIDR range of the form x.x.x.x/x
  Subnets:
    Description: At least two public subnets in different Availability Zones in the selected VPC
    Type: "List<AWS::EC2::Subnet::Id>"
  VPC:
    Type: "AWS::EC2::VPC::Id"
    Description: A virtual private cloud that enables resources in public subnets to connect to the internet

Resources:
  ELBSecurityGroup:
    Type: AWS::EC2::SecurityGroup
    Properties:
      GroupDescription: ELB Security Group
      VpcId: !Ref VPC
      SecurityGroupIngress:
        - IpProtocol: tcp
          FromPort: 80
          ToPort: 80
          CidrIp: 0.0.0.0/0

  EC2SecurityGroup:
    Type: AWS::EC2::SecurityGroup
    Properties:
      GroupDescription: EC2 Security Group
      VpcId: !Ref VPC
      SecurityGroupIngress:
        - IpProtocol: tcp
          FromPort: 80
          ToPort: 80
          SourceSecurityGroupId:
            Fn::GetAtt:
              - ELBSecurityGroup
              - GroupId
        - IpProtocol: tcp
          FromPort: 22
          ToPort: 22
          CidrIp: !Ref SSHLocation

  EC2TargetGroup:
    Type: AWS::ElasticLoadBalancingV2::TargetGroup
    Properties:
      HealthCheckIntervalSeconds: 30
      HealthCheckProtocol: HTTP
      HealthCheckTimeoutSeconds: 15
      HealthyThresholdCount: 5
      Matcher:
        HttpCode: 200
      Name: EC2TargetGroup
      Port: 80
      Protocol: HTTP
      TargetGroupAttributes:
        - Key: deregistration_delay.timeout_seconds
          Value: "20"
      UnhealthyThresholdCount: 3
      VpcId: !Ref VPC

  ALBListener:
    Type: AWS::ElasticLoadBalancingV2::Listener
    Properties:
      DefaultActions:
        - Type: forward
          TargetGroupArn: !Ref EC2TargetGroup
      LoadBalancerArn: !Ref ApplicationLoadBalancer
      Port: 80
      Protocol: HTTP

  ApplicationLoadBalancer:
    Type: AWS::ElasticLoadBalancingV2::LoadBalancer
    Properties:
      Scheme: internet-facing
      Subnets: !Ref Subnets
      SecurityGroups:
        - !GetAtt ELBSecurityGroup.GroupId

  LaunchTemplate:
    Type: AWS::EC2::LaunchTemplate
    Properties:
      LaunchTemplateName: !Sub ${AWS::StackName}-launch-template
      LaunchTemplateData:
        ImageId: !Ref LatestAmiId
        InstanceType: !Ref InstanceType
        KeyName: !Ref KeyName
        SecurityGroupIds:
          - !Ref EC2SecurityGroup
        UserData:
          Fn::Base64: !Sub |
            #!/bin/bash
            yum update -y
            yum install -y docker
            systemctl start docker
            docker pull your_dockerhub_username/image
            docker run  --rm -p 80:5000 your_dockerhub_username/image
  NotificationTopic:
    Type: AWS::SNS::Topic
    Properties:
      Subscription:
        - Endpoint: !Ref OperatorEmail
          Protocol: email

  WebServerGroup:
    Type: AWS::AutoScaling::AutoScalingGroup
    Properties:
      LaunchTemplate:
        LaunchTemplateId: !Ref LaunchTemplate
        Version: !GetAtt LaunchTemplate.LatestVersionNumber
      MaxSize: "3"
      MinSize: "1"
      DesiredCapacity: "1"
      NotificationConfigurations:
        - TopicARN: !Ref NotificationTopic
          NotificationTypes:
            [
              "autoscaling:EC2_INSTANCE_LAUNCH",
              "autoscaling:EC2_INSTANCE_LAUNCH_ERROR",
              "autoscaling:EC2_INSTANCE_TERMINATE",
              "autoscaling:EC2_INSTANCE_TERMINATE_ERROR",
            ]
      TargetGroupARNs:
        - !Ref EC2TargetGroup
      VPCZoneIdentifier: !Ref Subnets
Running this configuration in CloudFormation will create the resources defined in it. In the next section we’ll implement monitoring with CloudWatch.
Implementing Monitoring with CloudWatch
Monitoring is an important aspect when deploying applications to the cloud, it allows you to track the usage, availability and performance of your cloud resources. AWS has a built in monitoring tool called CloudWatch that can monitor and visualise metrics such as CPU utilisation, network traffic and other custom metrics you define.
CloudWatch Dashboard
CloudWatch Dashboards are customisable pages that allow you to view the state of different resources in a single page. They allow you to visualise resource metrics using different widgets such as line graphs, gauges and charts. You can select the colour used for each metric and add custom annotations to the graphs. In this section, I’ll show you how to create a basic dashboard in the AWS Console that monitors CPU Usage, number of running instances and the number of HTTP Requests handled by a load balancer.
Creating a dashboard in the console:
To create a dashboard, open the CloudWatch Console
In the navigation page, choose Dashboards and click Create Dashboard.
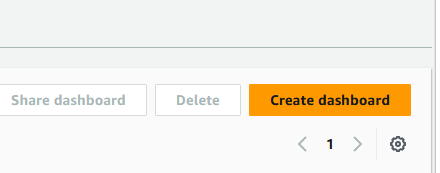
In the “Create New Dashboard” box, enter a name for the dashboard and select Create Dashboard.
In the next dialog box , you can choose widgets to add to the dashboard.
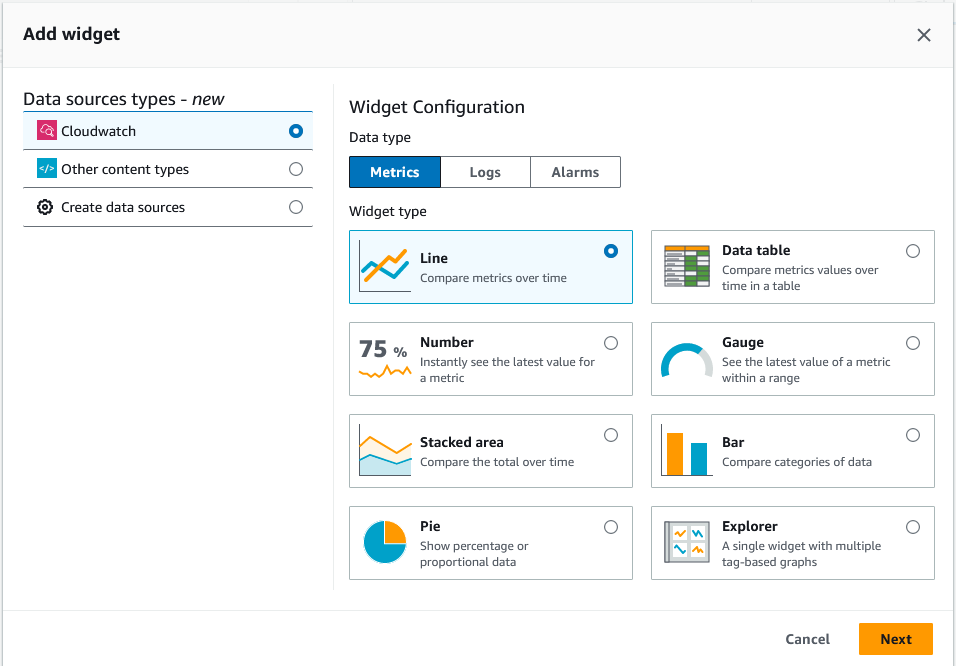
For this project, I will create a dashboard that uses gauges for the CPU and number of instances metrics and a line graph for the HTTP Requests.
CPU Utilisation
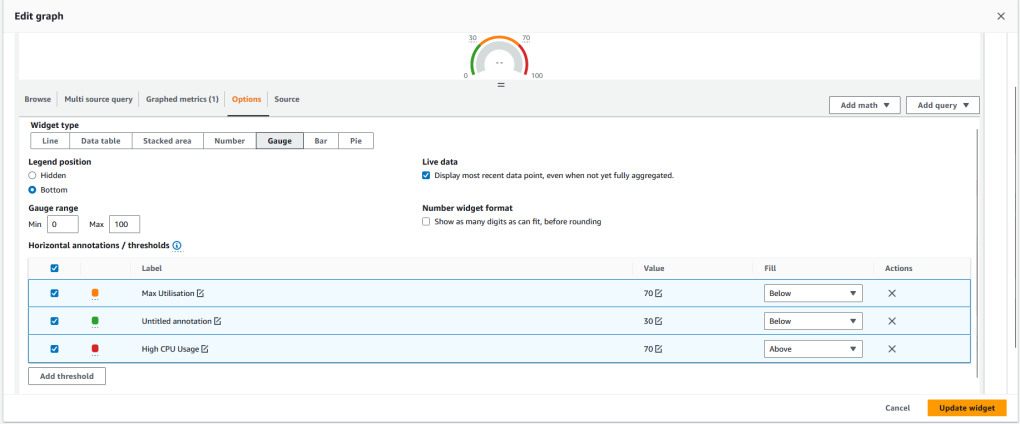
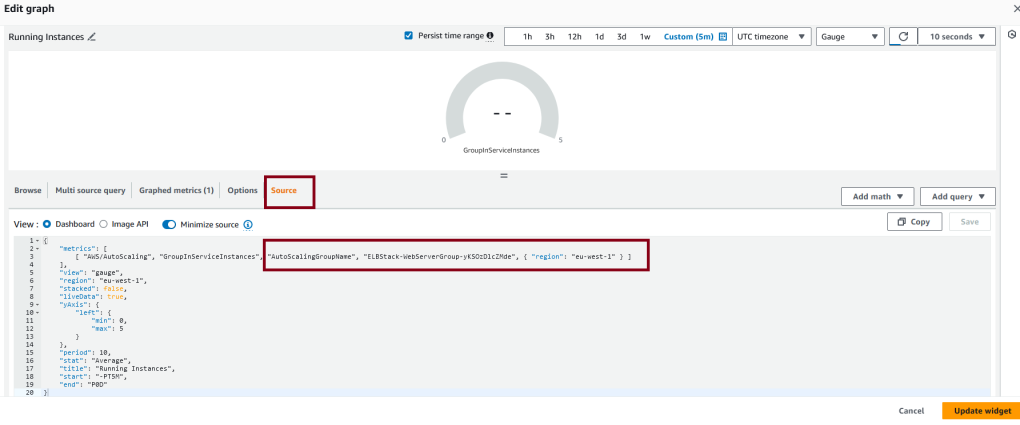
Add a gauge from the widget menu and configure it to use the Autoscaling group as its data source in the Source tab. In the metrics section, add the region and name of the Auto Scaling Group you created using CloudFormation in the previous steps.
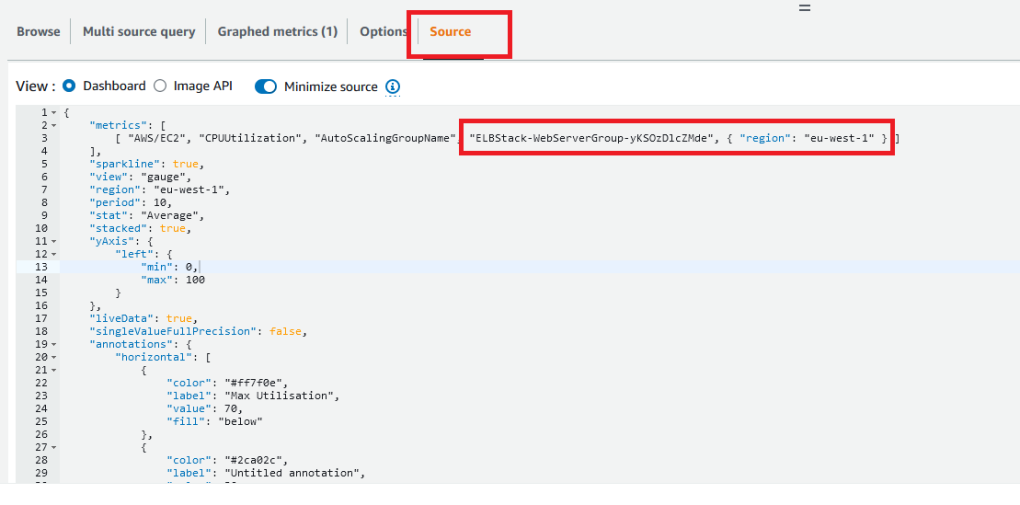
My full source configuration looks like this:
{
"metrics": [
[ "AWS/EC2", "CPUUtilization", "AutoScalingGroupName", "ELBStack-WebServerGroup-yKSOzDlcZMde", { "region": "eu-west-1" } ]
],
"sparkline": true,
"view": "gauge",
"region": "eu-west-1",
"period": 10,
"stat": "Average",
"stacked": true,
"yAxis": {
"left": {
"min": 0,
"max": 100
}
},
"liveData": true,
"singleValueFullPrecision": false,
"annotations": {
"horizontal": [
{
"color": "#ff7f0e",
"label": "Max Utilisation",
"value": 70,
"fill": "below"
},
{
"color": "#2ca02c",
"label": "Untitled annotation",
"value": 30,
"fill": "below"
},
{
"color": "#d62728",
"label": "High CPU Usage",
"value": 70,
"fill": "above"
}
]
},
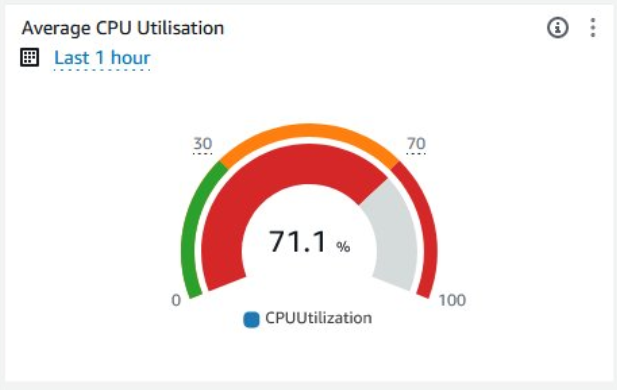
"title": "Average CPU Utilisation",
"start": "-PT5M",
"end": "P0D"
}
This creates a gauge that displays the average CPU Utilisation from the auto scaling group. If the CPU usage is between 0% and 30% the gauge will be in the green. If the usage is between 30 and 70% it will be in the orange range and if the usage is over 70% it will be in the red range. Here’s an example of how the CPU gauge should look when its in the red:
Running Instances Gauge
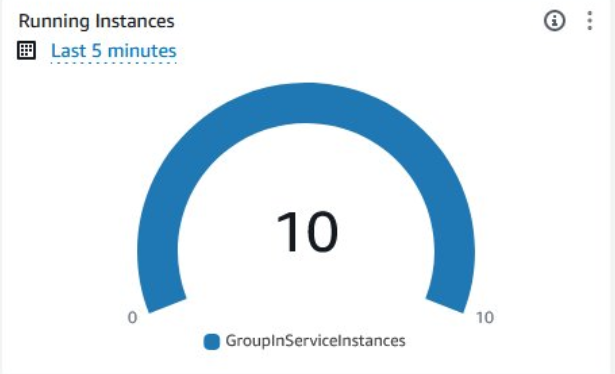
The process to create a gauge to show the number of running instances is similar to the one above. Add a gauge widget and select the GroupServiceInstances metric as its source and use the auto scaling group you created earlier. This metric displays the number of running instances that are part of the auto scaling group.
You can adjust the gauge min and max values by adding min and max to the yaxis property. This gauge should look something like this when working correctly:
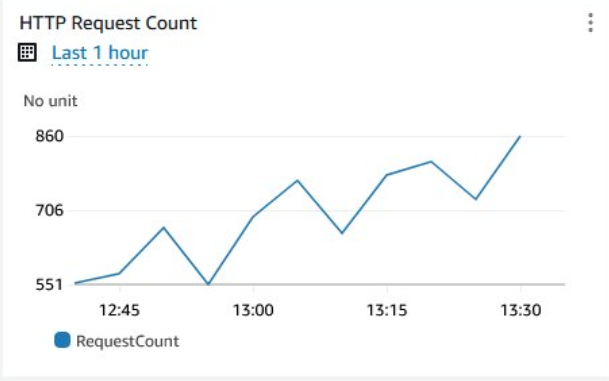
HTTP Request Count Graph
The last widget we’ll add is one that shows the number of HTTP Requests the load balancer has handled in a given time period. Measuring the number of HTTP requests can be useful to keep track of traffic spikes, analyse traffic volume over time and detect anomalies. For this widget, use a line graph and select the RequestCount metric from the Load Balancer:
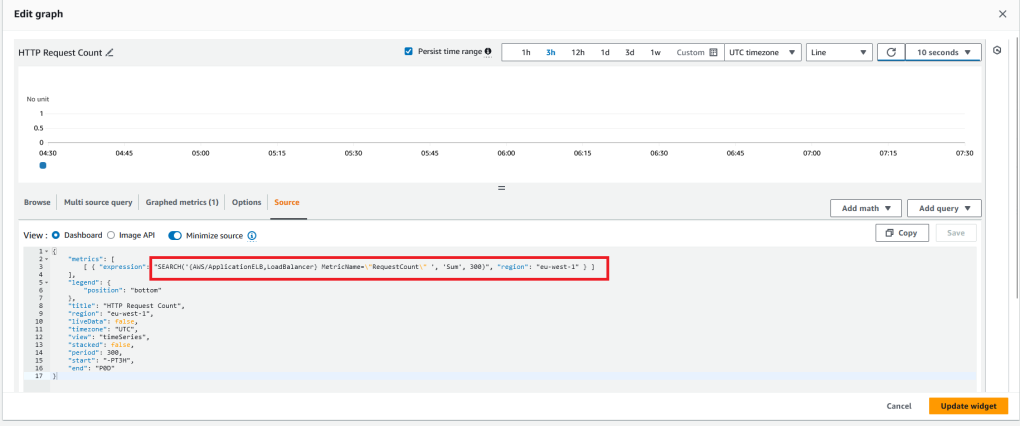
The graph should look something like this once the load balancer starts receiving traffic:
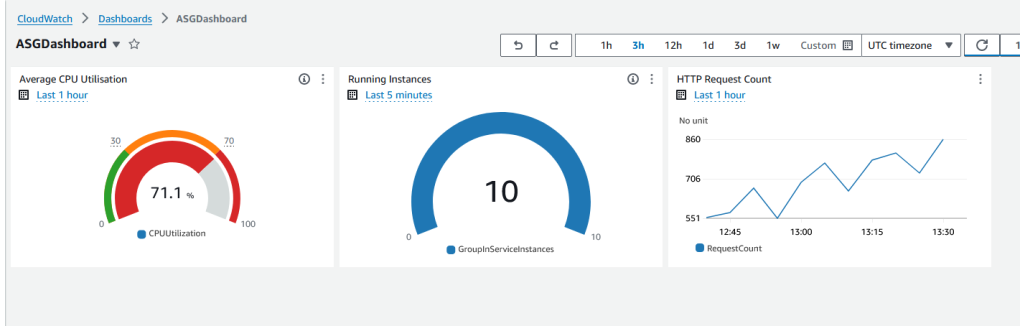
The Complete Dashboard
Once you have done all the steps above, you’ll have a single dashboard that shows CPU Usage, the number of running instances and the number of HTTP requests the load balancer has handled in one view.
Conclusion:
This article covered why auto scaling is important in keeping your workloads and applications online and cost efficient. It also covered how to automate the creation of auto scaling architecture using CloudFormation, how to create reusable templates using CloudFormation Parameters and lastly, how to add monitoring dashboards using CloudWatch. I hope you found it useful.